 [
[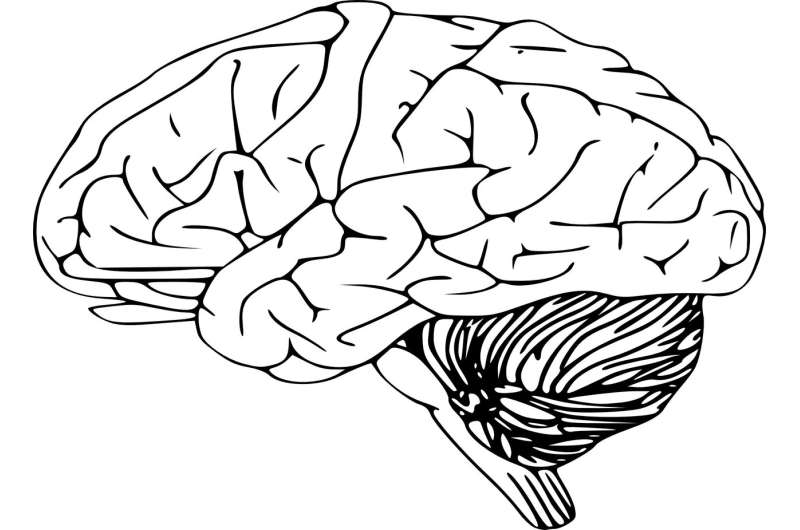
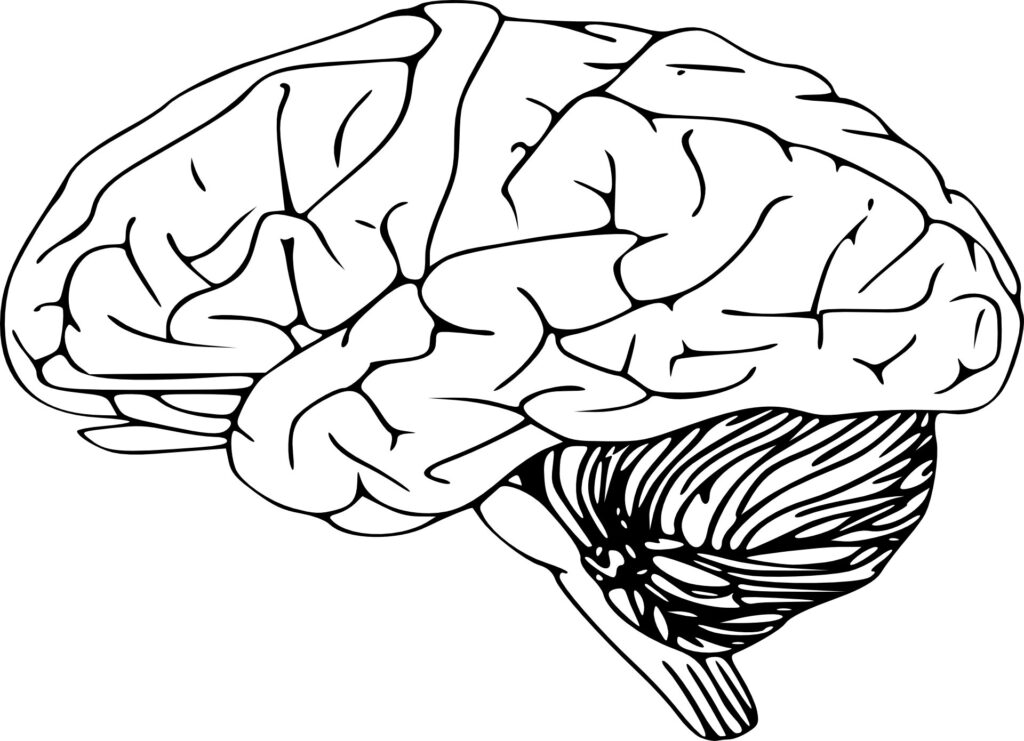
In a new study published recently in the journal Nature, researchers at Vanderbilt University and Vanderbilt Health have created the first growth charts for white matter in the brain over a human lifetime. The work brings together nearly two decades of Vanderbilt research collaborations, the university’s extensive MRI data collections, and an advanced AI-enabled computing platform.
White matter consists of bundled nerve fibers that transmit signals throughout the brain and the rest of the body. Rather than looking at the brain as a single unit, the researchers mapped 72 distinct functional “highways”—distinct white-matter pathways in the brain—and tracked how they grow and age from birth to 100 years old.
Just as height and weight charts help pediatricians monitor the growth of young children, white matter growth charts may one day be used by neurologists to track neural network development and detect abnormalities associated with brain disorders like Alzheimer’s, Parkinson’s, or epilepsy before symptoms become apparent.
“White matter is constantly changing over a human lifespan. This study—for the first time—fully characterizes white matter at each stage of brain development, bringing together research findings from the past 50 years,” said Kurt Schilling, assistant professor of radiology and radiological sciences and a senior author of the Nature study.

“This work will unlock new avenues for researchers to identify and investigate unique patterns in how the brain changes over the course of a human’s life. Applications could be used for areas ranging from autism, ADHD, dyslexia, epilepsy, and multiple sclerosis to Alzheimer’s, Parkinson’s, and more. There’s not a single neurodegenerative disease that doesn’t implicate white matter dysfunction in some way.”
Michael Kim, a Vanderbilt Ph.D. student in computer science who was the study’s lead author, added, “Defining these pathway-specific trajectories and milestones allows researchers to explore interesting neurobiological questions. They also help us investigate how white matter abnormalities present similarly or differently across diseases.”
The study distilled and analyzed MRI data from nearly 42,000 brains, comprised of more than 4 million individual images—an unprecedented data set that has been a central focal point for Bennett Landman, a key contributor to the study whose work has helped standardize and align imaging data across multiple studies.
“What’s exciting is that these data harmonization efforts—really a decade in the making that involved numerous collaborations between Vanderbilt University and Vanderbilt Health—are reaching the point of enabling transformative discovery,” he said. Landman, University Distinguished Professor in Electrical and Computer Engineering and Radiology and Radiological Sciences, also directs the Vanderbilt Lab for Immersive AI Translation (VALIANT).
Charting white matter’s milestones
To create the white matter growth charts, researchers analyzed data from diffusion MRI, or dMRI, samples across 50 population studies of typically developing brains with no known neurological or psychiatric conditions—about 35,000 after screening for abnormalities. Some of the key findings the Vanderbilt researchers uncovered:
Overall volume peaks in the early 30s: Cerebral white matter volume expands rapidly during early development, hitting its peak in a person’s early to mid 30s, before beginning a gradual decline.
Pathway integrity plateaus in the 20s: A key marker of white matter organization and integrity (fractional anisotropy) matures even earlier, rising quickly through childhood and adolescence before reaching a tipping point in the mid 20s, after which it steadily declines.
Circuitry growth and decline happens independently: Rather than following a single brain-wide schedule, the 72 distinct pathways mature and degenerate at their own rates. This means that circuits associated with different brain functions follow completely distinct timelines of growth and vulnerability.
There’s a deep link between maturation and aging: The charts revealed symmetrical patterns in how the brain’s wiring lifecycle unfolds. White matter pathways that take the longest to fully mature also tend to resist aging the longest, delaying the onset of decline. However, when looking at the speed of these changes, pathways that experience the most rapid, explosive growth during adolescence are the ones that degrade the fastest later in life.
The study did not address what happens to specific brain functions like cognition at various points of development, so how these peaks and declines affect behavior is still an open question, the researchers said. These normative measurements do, however, offer anatomical reference points for the development—and subsequent degeneration—of the brain’s white matter over time.
Comparisons of white matter development in a typical brain compared with brains with known neurological or psychiatric conditions did yield striking differences across the entire human lifespan, however.
The researchers analyzed data from dMRI scans of people with neurodevelopmental and psychiatric conditions, including autism, ADHD, schizophrenia, anxiety, and depression, as well as neurodegenerative diseases like Alzheimer’s and mild cognitive impairment. They found disorder-specific deviations in white matter growth and degeneration compared to a healthy baseline depicted in the charts. For instance, while MCI and Alzheimer’s patients showed widespread, pronounced structural degradation, other conditions exhibited unique spatial patterns of deviation.
Laurie Cutting, Patricia and Rodes Hart Professor of Neuroscience in Peabody College and a co-author on the study, said tools like the white matter growth chart could one day serve as a sensitive tool for tracking a wide array of brain health issues.
“What if you knew early on if white matter patterns deviated from what they should be in areas that we know are associated with reading abilities?” said Cutting, a specialist in dyslexia and language disorders. “You could think about early intervention to address difficulties children might encounter, such as those with dyslexia, well before they struggle with reading.”
Even for those with a typical brain anatomy, the white matter chart offers an important point of reference for overall “brain wellness,” said John Gore, University Distinguished Professor of Physics and Radiology and Radiological Sciences and a co-author of the paper.
“People talk about healthy aging,” said Gore, who in 2002 founded the Vanderbilt University Institute of Imaging Science. “This could encourage people to look at (their) brain health. We take care of our bodies by changing our diet, by exercising and by doing various things to overcome the effects of aging. What should we be doing to protect the brain?”
The study’s authors have made the white matter charts and underlying computer code publicly available, giving researchers a new way to track how the brain develops, ages, and deviates from typical patterns over time.
With more than 30 Vanderbilt-affiliated authors, this latest study published in Nature relies on neuroimaging, MRI methodologies, and computing infrastructure built by Vanderbilt and Vanderbilt Health researchers over the past two decades. Two key research strands pioneered at Vanderbilt that enabled the work on white matter characterization include transforming brain scan images into quantitative, standardized data sets and developing and validating methods for the use of diffusion MRI.
Stretching back to his graduate work at the intersection of engineering and medicine, Landman has contributed to quantitative radiology by deriving numerical markers from large sets of raw imaging data and making them comparable across studies. “At Vanderbilt, we had a tremendous opportunity to scale small studies into very large studies through coordinated multi-PI collaborations,” Landman said. “Because of this, we built systems to support consistent processing and achieved stable results over decade-long timeframes.”
Those efforts brought together expertise from across the university, including VUIIS, which specializes in MRI acquisition and analysis; the Center for Computational Imaging, which develops methods for processing and standardizing large imaging datasets; and the Advanced Computing Center for Research and Education, which provides high-performance computing to analyze them at scale.
It also drew on work by the Alzheimer’s Disease Sequencing Project and the Phenotype Harmonization Consortium, both of which bring together imaging, genomics, and clinical data to enable machine learning and other data analysis tools.
As Landman and others built systems to standardize and analyze imaging data, Schilling became a leading figure in diffusion MRI. Like dropping ink in water, dMRI tracks the direction of that movement through brain tissue, allowing researchers to map its internal wiring—white matter pathways.
Schilling, who earned his Ph.D. in biomedical engineering at Vanderbilt in 2017, began working on diffusion MRI as a postdoctoral research fellow in the VUIIS, and he joined the radiology faculty in 2020. With colleagues including Gore, Landman, and others across Vanderbilt, he pioneered the validation of advanced modeling techniques for the fibers and microstructures of the brain. Over the past decade, Schilling and his colleagues have vastly expanded the use of dMRI and established it as a gold standard for analyzing the brain’s intricate structural networks.
For Schilling and Landman, this study represents a new era of neuroimaging research, one that goes beyond single images and instead builds a trajectory of how the brain’s wiring changes and evolves at every phase of a human’s life.
“It took this huge collaborative effort—yes, within Vanderbilt, but also outside of it—to make it possible to study these changes over an entire lifetime,” Schilling said. “But now this work opens a whole world to anyone wanting to study brain development, aging, or disease and disorders. The scale of this is unlike anything we’ve ever seen.”
That collaborative environment also shaped the experience for Kim, a doctoral candidate in computer science, who said Vanderbilt’s tightly connected network of researchers made the work possible. “When I applied to Vanderbilt, one of the selling points was that all these researchers and institutes are so close to each other,” he said. “It really allows us to form strong collaborations much more easily across diverse research groups.”
One final coda: During the course of the study, Kim’s mother was diagnosed with a terminal illness. She died in December 2025. “Her diagnosis was made in part by the same kind of neuroscience imaging we’re all working on,” he said. “Knowing that I am doing the kind of science that could help someone else—even a little bit—that’s been the most important part of all this for me.”
Publication details
Michael E. Kim et al, White matter micro- and macrostructure brain charts for the human lifespan, Nature (2026). DOI: 10.1038/s41586-026-10454-2
Journal information:
Nature


Citation:
Brain maps reveal first lifetime white matter growth charts from birth to 100 (2026, May 28)
retrieved 28 May 2026
from https://medicalxpress.com/news/2026-05-brain-reveal-lifetime-white-growth.html
This document is subject to copyright. Apart from any fair dealing for the purpose of private study or research, no
part may be reproduced without the written permission. The content is provided for information purposes only.

Khamrah by Lattafa for Men - 3.4 oz EDP Spray
4% Off
Ghost Sweetheart Eau de Toilette | Pineapple, Jasmine and Sandalwood | Perfume for Women 50 ml
50% Off
Marc Jacobs Dot Eau De Parfum for Women, 100 ml
42% Off
Ted Baker W Eau de Toilette for Her, Fig Leaf, White Peony and Violet Top Notes, Pink Orchid and Raspberry Middle Notes, 75ml
£11.77 (£15.69 / 100 ml) (as of 28/05/2026 03:23 GMT +01:00 - More infoProduct prices and availability are accurate as of the date/time indicated and are subject to change. Any price and availability information displayed on [relevant Amazon Site(s), as applicable] at the time of purchase will apply to the purchase of this product.)
Ted Baker Woman Pink Eau de Toilette Spray Floral Green Feminine Fragrance, Opening Notes are Fresh Peach, Bergamot and Tangerine with Warm Musk, Vanilla and Vetiver Base, 100ml
11% Off
Vera Wang Princess Eau de Toilette - 30 ml

Choco Musk 50ml Eau De Parfum for men and women | Chocolate Musk by Jannat Aromas
17% Off
Christina Aguilera Signature Eau de Parfum (50ml) Floral, Fruity & Exotic Scent, Luxury Fragrance for Women
9% Off
Calvin Klein - Eau De Toilette CKIN2U - Calvin Klein Women, Ladies Perfume, Women's Perfume, Calvin Klein Perfume, Calvin Klein One - 150 ml
5% Off
Jimmy Choo Flash Eau de Parfum, 60 ml (Pack of 1)
3% Off
Fruit of the Loom Men's Heavy T Shirt, White, XL UK
28% Off
ATNKE LED Lighted Beanie Cap,USB Rechargeable Running Hat Ultra Bright 4 LED Waterproof Light Winter Warm Gifts for Men and Women/Pink
17% Off
Men's 1/4 Zip Pullover UK Sale Clearance, Fleece Sweatshirt Casual Jumper Long Sleeve T-shirt Top Stand Collar Sweater Plain Pullover Sports Leisure Workwear Quarter Zip Sweater Lightweight Jumpers
£5.88 (as of 12/11/2025 00:52 GMT +01:00 - More infoProduct prices and availability are accurate as of the date/time indicated and are subject to change. Any price and availability information displayed on [relevant Amazon Site(s), as applicable] at the time of purchase will apply to the purchase of this product.)
Crevice Cleaning Brush, Bathroom Tile Groove Gap Cleaning Brush,Premium Crevice Cleaning Tool Aluminum Support with 15° Angle Magic Brush, Thin Brush for Home Kitchen
19% Off
Wireless Earbuds, Bluetooth 5.3 Headphones in Ear with HiFi Stereo Deep Bass, 4 ENC Noise Cancelling Mic Wireless Earphones 40H Playtime, Bluetooth Earbuds Dual LED Display, IP7 Waterproof, USB-C
42% Off